No account
there is nothing to sign into. Open the page, drop in a backup, done.
cronowiz spends the year writing things down: every run, every set, every resting heart rate, every night your recovery was worse than you thought. cw·dashboard is where that year is finally readable. Same principle as the app — free, no account, nothing leaves your browser — with the screen space and the maths to show what a single session never can.
The app doesn't send your data anywhere, and neither does the dashboard. Not because we promise it — because there is nowhere for it to go.
there is nothing to sign into. Open the page, drop in a backup, done.
there is no cw·dashboard backend. Your sessions live in your browser's IndexedDB and go no further.
the file you import is read in the page. It is never sent anywhere, not even to us, not even briefly.
no analytics, no fonts fetched from someone else's CDN, no embedded anything. The one network call it can make is to the AI endpoint you configure yourself, and only if you configure one.
It's a PWA. Install it and it works with the aeroplane mode on, because there was never anything to be online for.
Roughly thirty analysis modules, all doing arithmetic locally, on your data. Nothing here is a rounded-off "score" — every number traces back to a model with a name and a source.
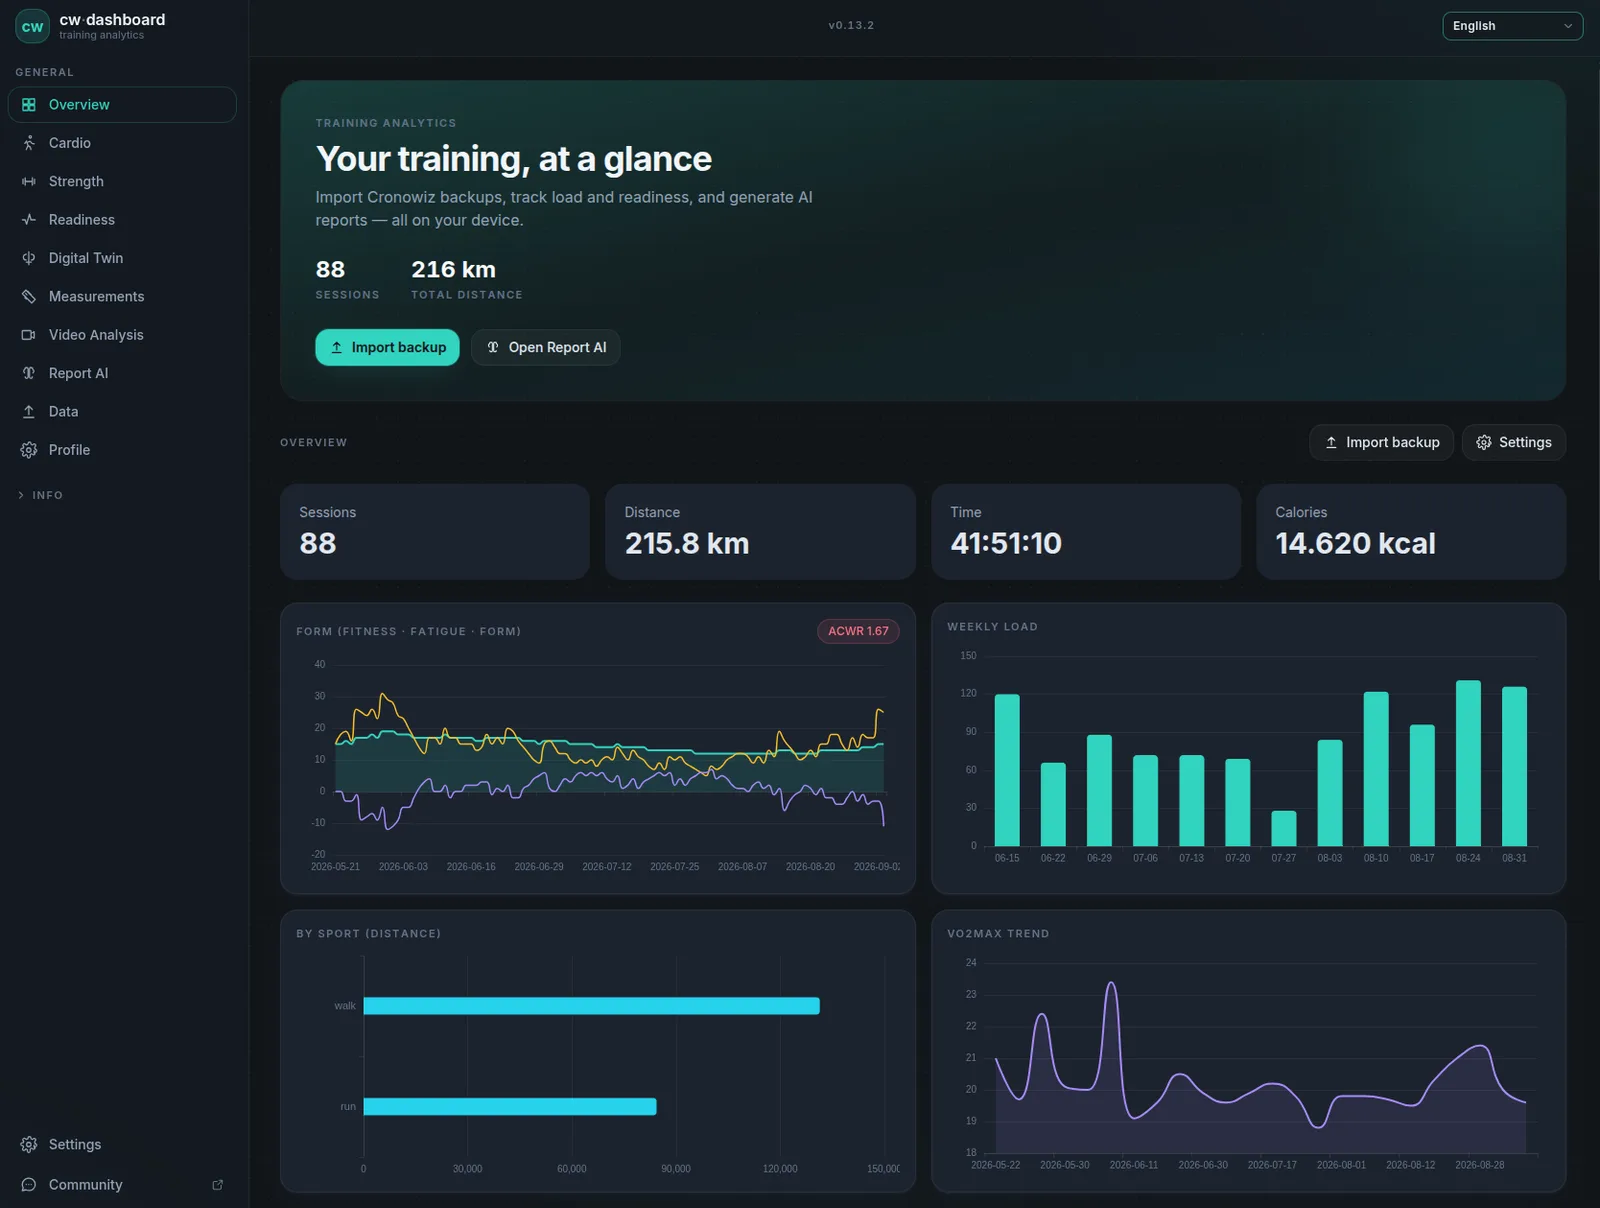
fitness, fatigue and form (CTL, ATL, TSB) on the Banister model, plus acute-to-chronic workload ratio. The chart where you find out that the week you felt strong was the week you were most rested, not most trained.
built from HRV when your baseline is long enough, and from the load balance when it isn't. It tells you which of the two it used, instead of handing you a number and a colour.
splits, heart-rate zones, best efforts across every duration, VO₂max trend, grade-adjusted pace, elevation profile, and a cinematic replay of the route on the map.
every set logged, progression per exercise, weekly volume, tonnage by muscle group over months, session comparison, and a 1RM estimated from your own load–velocity line rather than a table.
weight, circumferences, HRV measurements and recovery tests, each with its own history.
the bar-velocity and form-check analyses your phone produced, collected here as a history instead of a one-off result you saw once and lost.


The most interesting thing in the dashboard is the least common. Feed it a hypothetical load — the plan you're considering, the week you're about to have — and it projects your form forward from the state you are actually in.

Projection
move the levers and watch fitness, fatigue and form respond, weeks ahead of the decision.
Backtest
it replays the model against your own past, up to a date, and shows you what it would have predicted versus what happened. You get to judge whether to trust it.
Risk
where the projected trajectory crosses the zones that historically precede a bad week.
Load advice
a suggested adjustment when your plan and your recovery disagree, with the reasoning shown.
It tells you when it doesn't have enough history to calibrate on you, instead of projecting confidently from nothing. That refusal is the feature.
The dashboard can write reports about your data — but it doesn't ship a model and it doesn't call anyone's API. You point it at an endpoint you control, typically an Ollama on your own machine, and it stays off until you do.
Five kinds of report
period summary, readiness and load, performance progression, next session, load progression. Or the full one, which runs them all and stitches the result together.
Written on real numbers
the prompt is built from your computed metrics, not from raw GPS traces or RR intervals. Those never leave the browser.
It knows when it's stale
if the data changed after a report was written, it says so instead of letting you read an answer about last month.
Kept
reports are archived as they're regenerated, so you can read what the picture looked like in March. Export any of them to Markdown or PDF.
Turn it off and everything else still works. The analysis was never the AI's job.
Two ways in, two ways out, and no cloud in any of the four.
Straight from the phone
scan a QR code or type a six-character code and the backup travels device to device over WebRTC. Peer to peer: the file doesn't pass through a server, ours or anyone's.
Or just the file
drop a .cwbackup on the page. It recognises whether it is a cronowiz vault or a full dashboard backup and does the right thing.
Merged, not duplicated
import the same backup twice, or a partial one, and sessions are matched by identity. Nothing doubles up.
Back to the phone
edit your plans on a real keyboard, export the vault, import it back into cronowiz.
A backup that's a file
everything, in one encrypted file, with a passphrase you choose. Put it where you like. There is no "restore from cloud" because there is no cloud.
Also from your watch
.fit files import directly, so sessions recorded outside cronowiz land in the same history.
There is a page inside the dashboard that explains what each number is and how it was computed. Not a help centre — the actual models, with the equations set properly: fitness and fatigue as exponentially weighted averages of daily load, RMSSD scored against a rolling baseline, the load–velocity line behind the 1RM estimate, the Minetti cost of running as a function of gradient.
If a fitness app won't tell you where a number came from, the number is a decoration. This one shows its work.
The dashboard holds the training history of one person: yours. That isn't a limit waiting to be unlocked — the code that handled several was removed, not disabled. It's free for personal use, and there is no tier above it.
cw·dashboard
works in your browser, offline, and asks for nothing.
cronowiz Studio
If you coach other people for a living, that's a different job and a different tool: cronowiz Studio is a desktop application with unlimited athletes and the database on your own machine. Same analysis engine, same principle about where data lives. The dashboard isn't its trial version — it's the half of the family that was always meant to be free.
Yes, and there is no tier above it. It is free for personal use, with no account, no trial period and no feature locked behind a payment. The paid product in the family is cronowiz Studio, which is a different tool for a different job — coaching several athletes.
No. There is nothing to sign into. You open the page, import a cronowiz backup, and the dashboard works. There is no registration form anywhere in it.
In your browser's IndexedDB, on the device you are using. There is no cw·dashboard server to receive it. The file you import is read inside the page and never uploaded — not to us, not to anyone.
Two ways. Scan a QR code or type a six-character code and the backup travels phone-to-browser over a direct WebRTC channel, without passing through a server. Or export a .cwbackup file from the app and drop it on the page.
Yes. It is a progressive web app: install it and it opens and computes with no connection at all. There was never anything it needed to be online for.
None by default. The dashboard ships no model and calls no API. You point it at an OpenAI-compatible or Ollama endpoint that you run — typically on your own network — and the feature stays off until you configure one. Turn it off and every chart still works.
Yes. .fit files import directly, so sessions recorded on a Garmin, a Suunto or anything else that exports FIT land in the same history as your cronowiz sessions.
No, by design. It holds one person's training history. The code that handled several was removed, not disabled. For coaching multiple athletes there is cronowiz Studio, a desktop application with the database on your own machine.
No. It computes sports-science metrics from your own training data and shows the formulas behind them. It is not a diagnostic tool and does not replace a doctor, a physiotherapist or a coach.